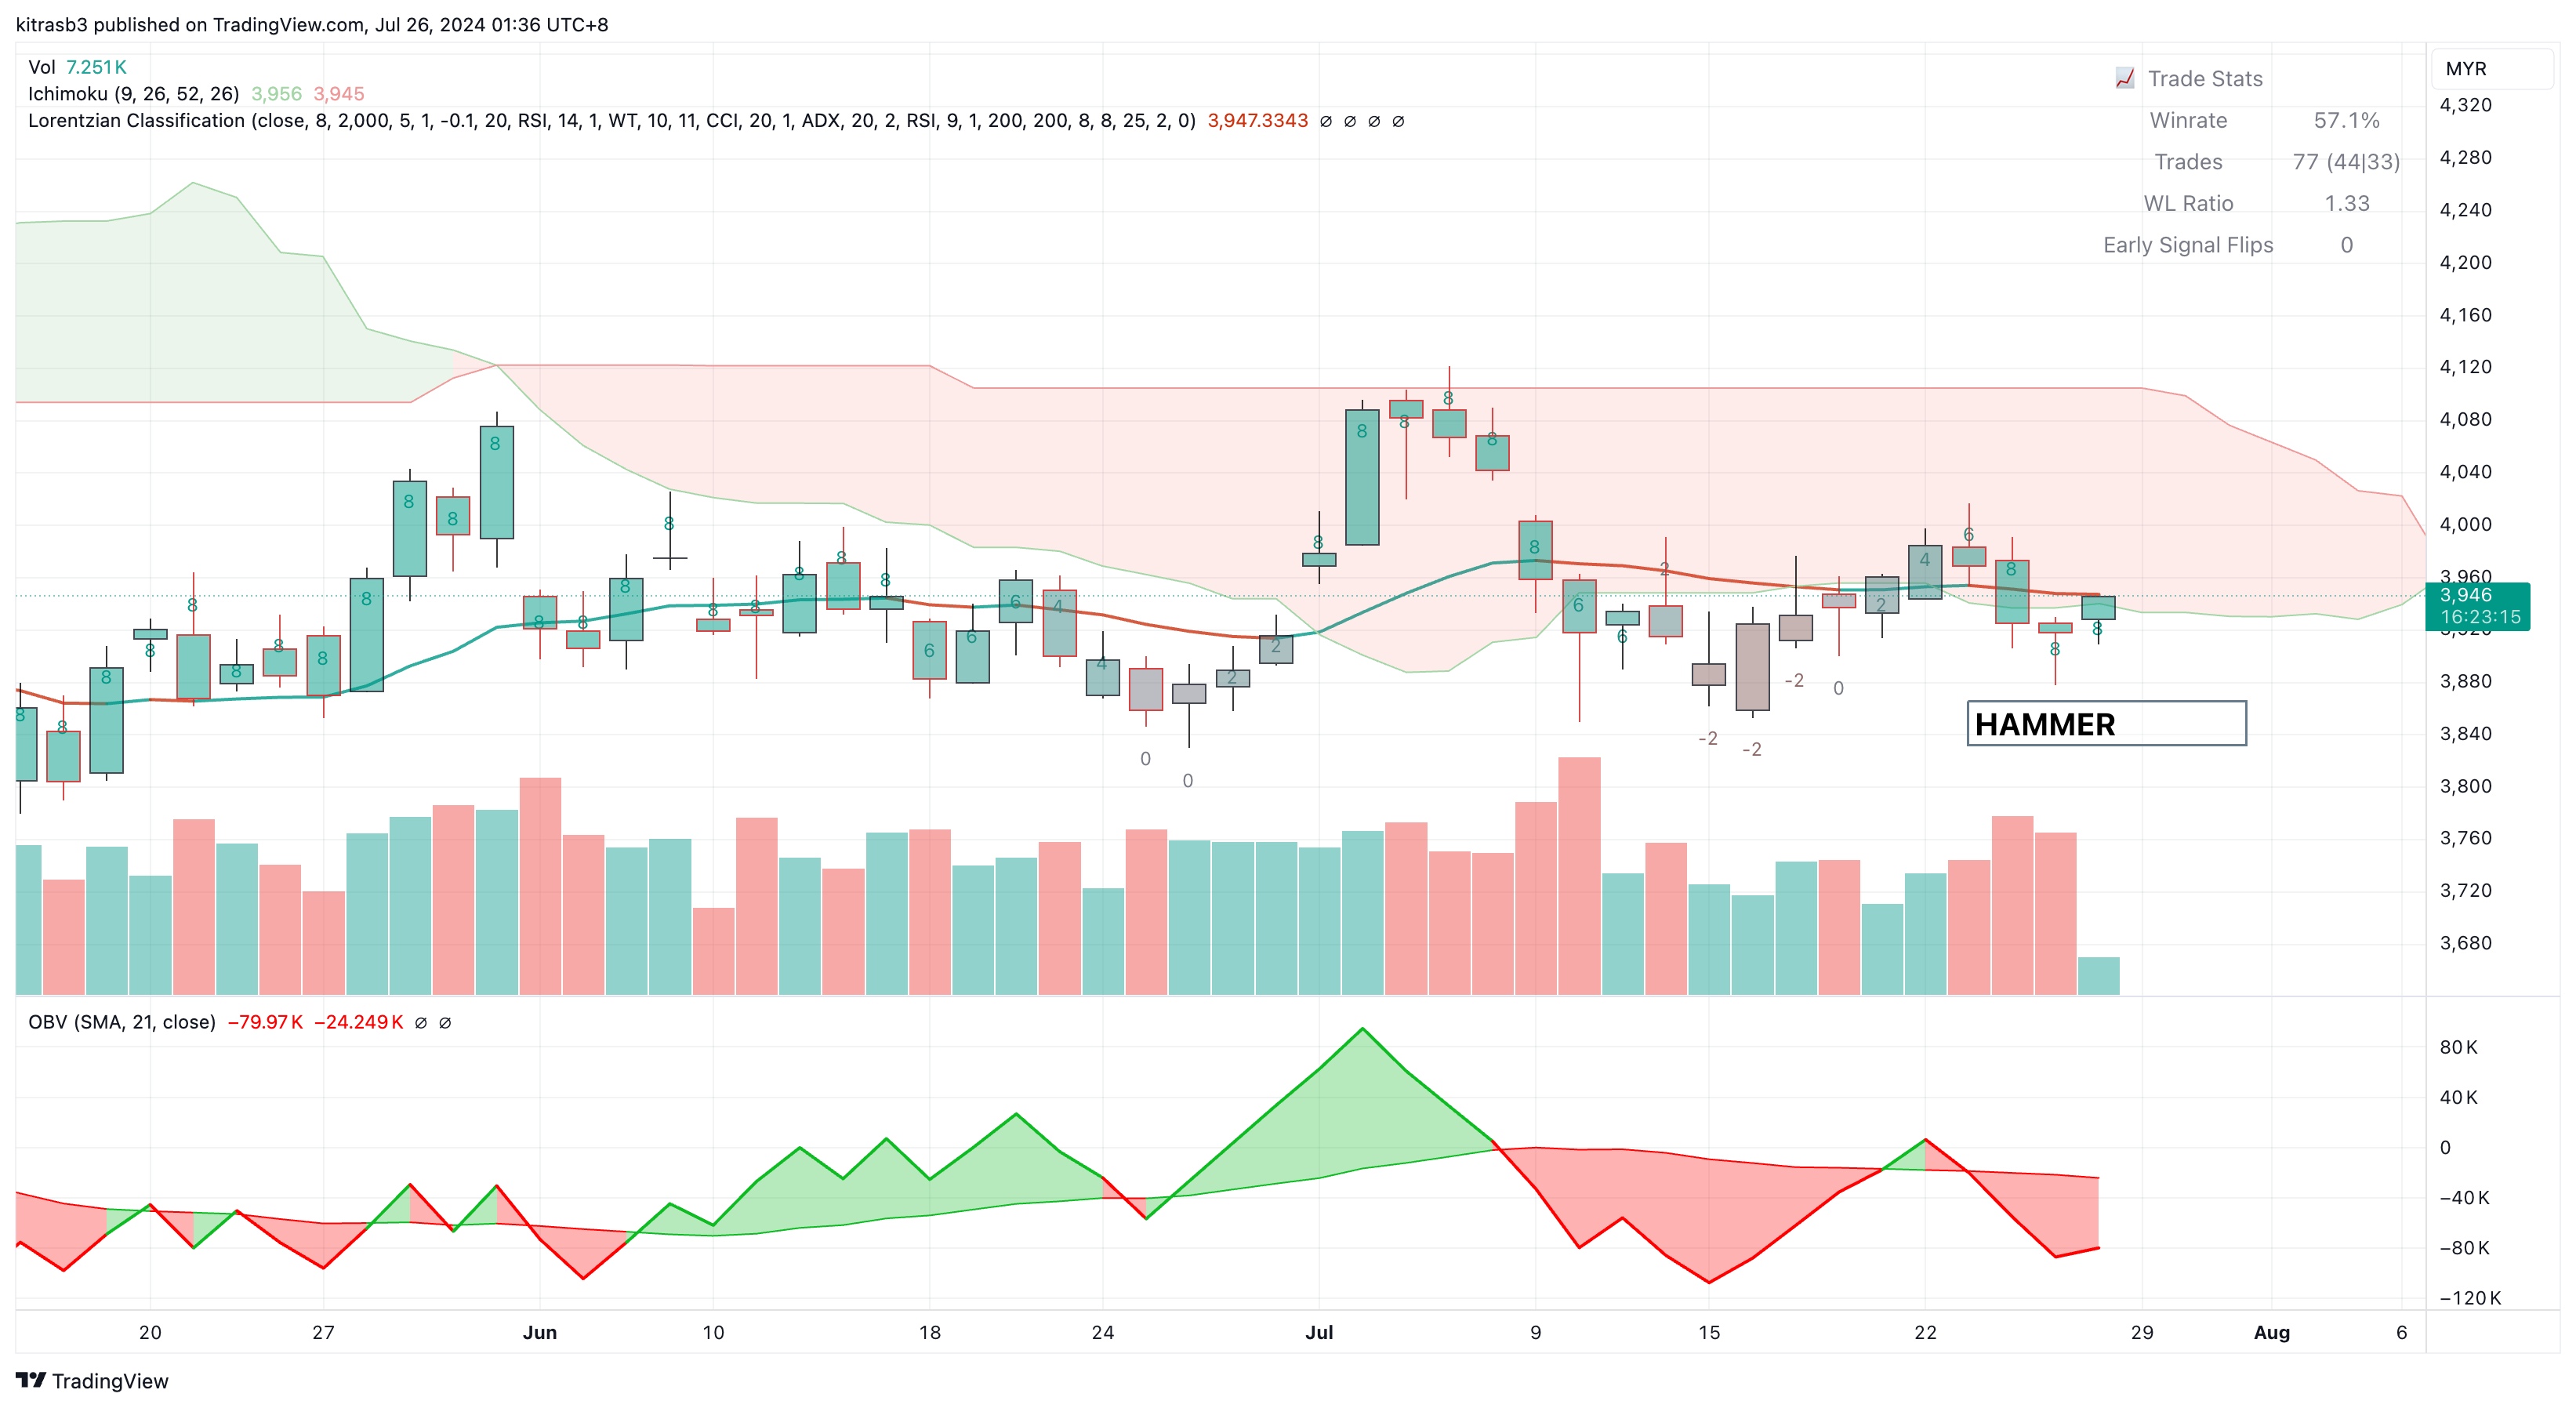
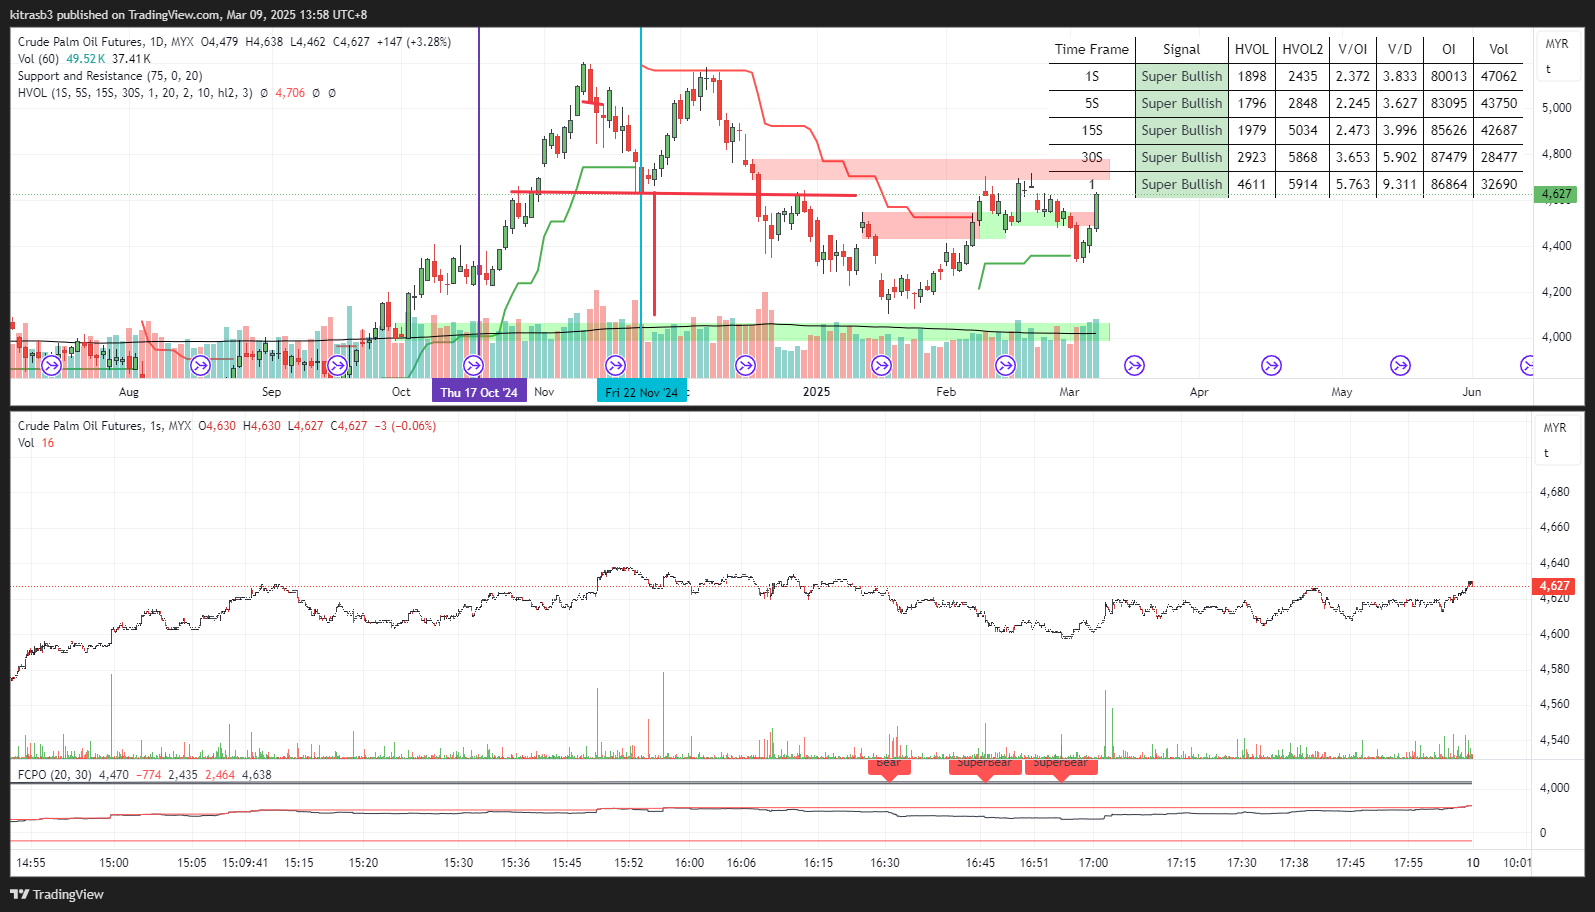
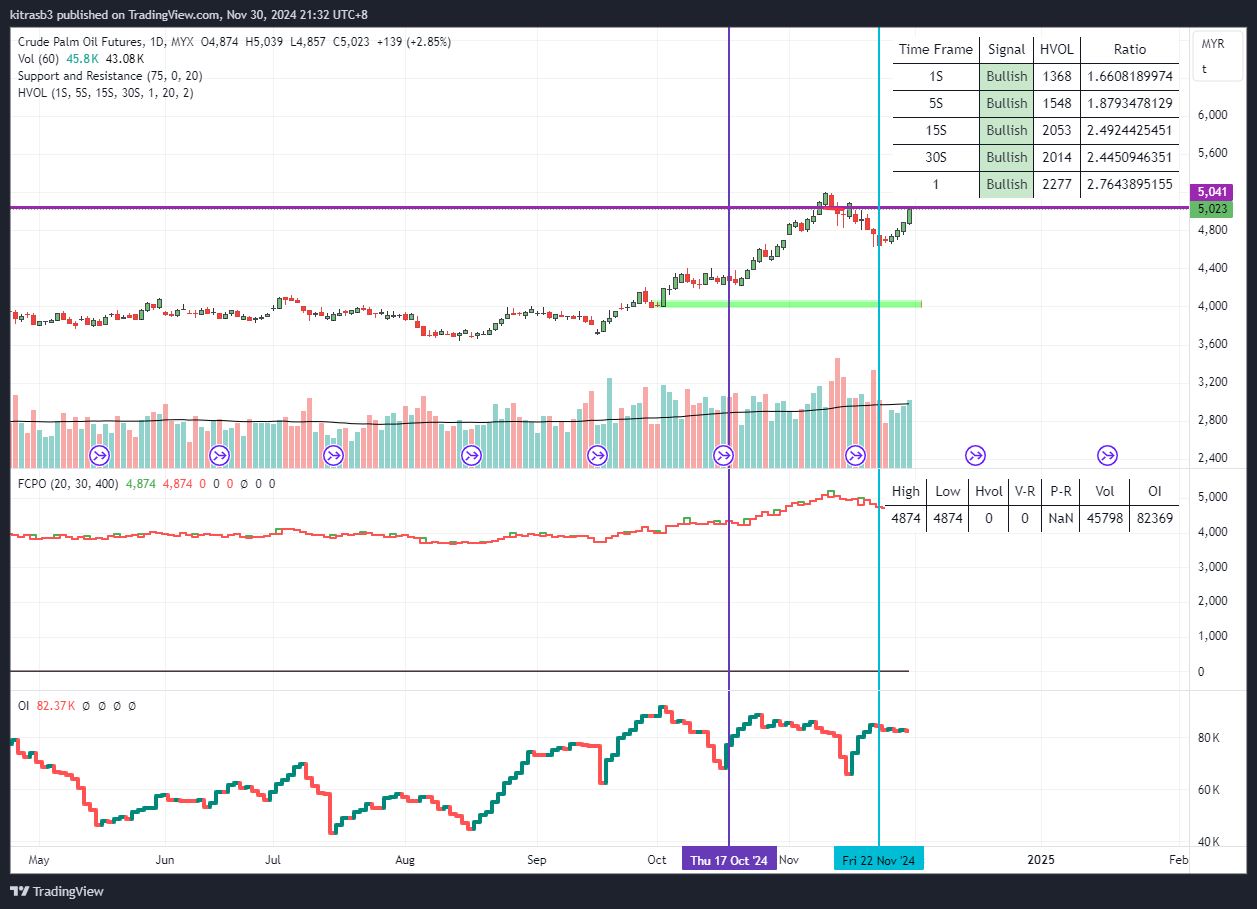
When the price of an asset goes down from MYR3926 to MYR3918 while both volume and open interest also decrease, it typically indicates the following:
1. Decreasing Market Participation: Lower volume during a price decline suggests that there are fewer traders and investors participating in the market. This can imply that the selling pressure is not strong, and the downward move might be driven by a lack of buying interest rather than aggressive selling.
2. Lack of Conviction: The decline in open interest means that existing positions are being closed rather than new positions being opened. This often indicates a lack of conviction among traders. They are not confident enough to open new positions, whether long or short, which suggests uncertainty or a lack of strong sentiment in either direction.
3. Potential for Reversal: Decreasing volume and open interest during a price decline can sometimes be a sign that the downtrend is losing momentum. Without strong selling pressure and with traders closing positions, the market might be nearing a point of exhaustion, potentially setting the stage for a price reversal or a period of consolidation.
4. Sideways Movement: This scenario might also indicate a period of consolidation where the price might trade sideways. The lack of strong directional movement could mean that the market is waiting for new information or a catalyst to drive the next significant move.
5. Ichimoku Chart Analysis still below the cloud indicates a bearish trend.
Overall, a price decline with decreasing volume and open interest is generally seen as a weaker bearish signal compared to a decline with increasing volume and open interest. It suggests a lack of strong conviction in the downtrend and could indicate that the market is poised for a potential reversal or a period of low volatility. Today, we noticed a hammer chart pattern at 3878 level. Likely, we shall some rebounce in price if tonite soy oil price go up.


